Clemson Undergraduate Admission Statistics
Clemson is looking for the next class of Tigers: students who’ve proven their academic capability and are driven to accomplish challenging work that creates a brighter future.
2025 First-Year Profile
High School Class Rank
-
SAT:
1250-1400
MIDDLE 50% OF SAT SCORES -
ACT:
28-32
MIDDLE 50% OF ACT SCORES
Acceptance Rate
Clemson University’s annual applicant pool has grown to over 60,000 applicants from all 50 states, the District of Columbia and more than two dozen countries worldwide. As a result, entrance has become highly competitive. However, since the 2021 undergraduate admissions cycle, 91 percent of all South Carolina applicants have been offered a path to Clemson through Fall admission, Summer admission or entrance into the Bridge to Clemson program.
We accepted 42 percent of all first-year applicants for admission in 2025. For the Class of 2029, 53 percent of in-state applicants were accepted for admission beginning in the Fall.
-
64,805
APPLIED -
27,498
ACCEPTED -
5,084
ENROLLED
-
91%
S.C. APPLICANTS OFFERED A PATH TO CLEMSON -
42%
ACCEPTANCE RATE
The Clemson Student Body
2025 Enrollment
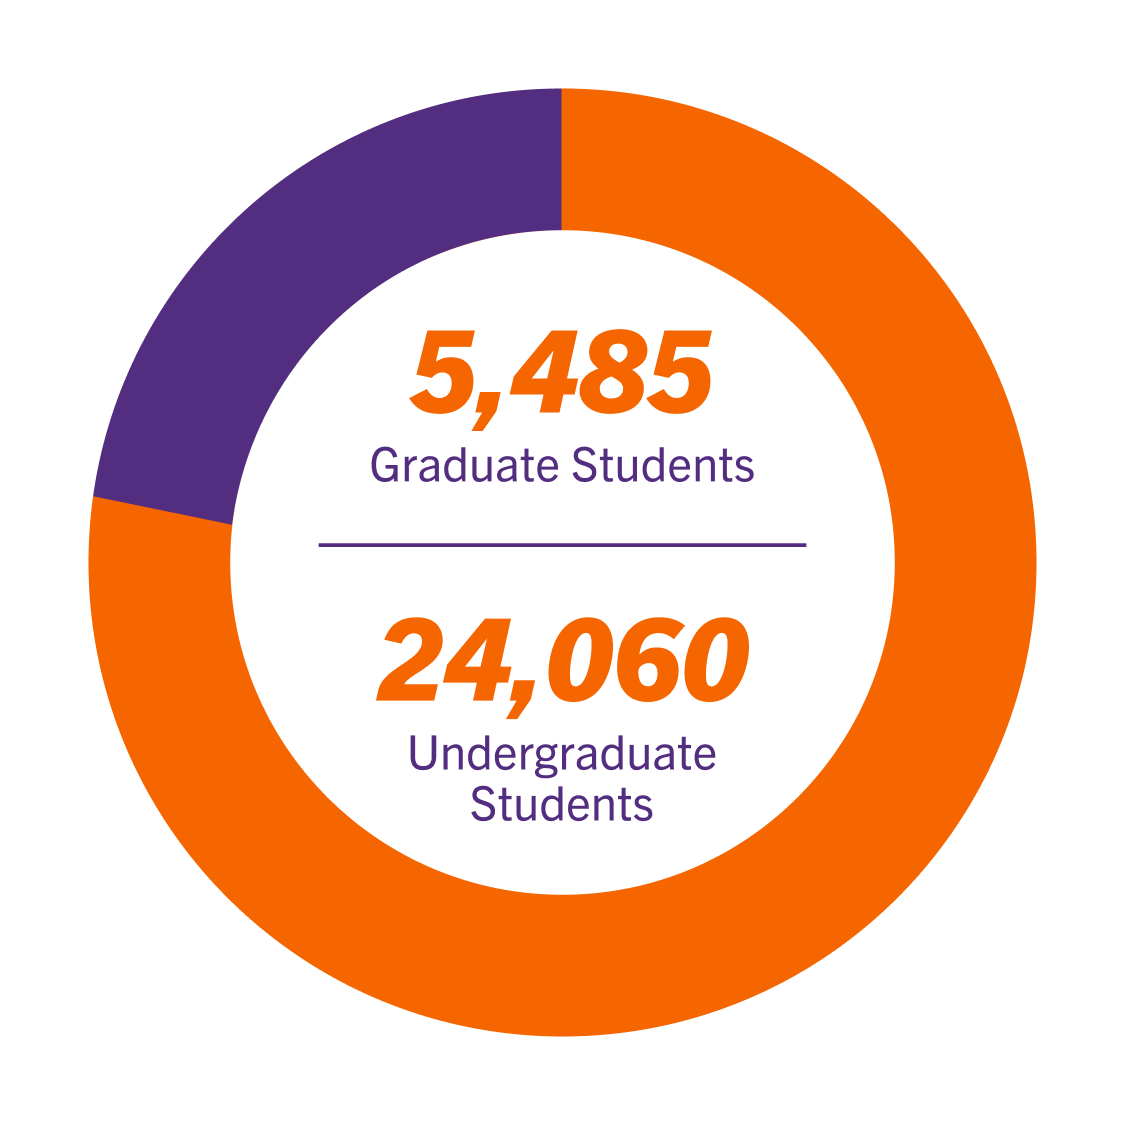
- 29,545 Total Enrollment
2025 Undergraduate Geographic Diversity
- 14,111 South Carolina
- 1,057 North Carolina
- 1,053 New Jersey
- 910 New York
- 872 Georgia
-
54%
FEMALE -
46%
MALE
2025 First-Year Class Representation
- 2,664 South Carolina Residents
- 281 South Carolina High Schools
- 1,547 Non-South Carolina High Schools
- 49 States and the District of Columbia
- 29 Foreign Countries
2025 Transfer Profile
-
3,829
APPLIED -
2,452
ACCEPTED -
1,798
ENROLLED
Academics Report
-
77%
INSTRUCTIONAL FACULTY WITH PH.D. OR EQUIVALENT -
78%
FULL-TIME INSTRUCTIONAL FACULTY

Clemson Tigers are engaged in their communities
Many people have hobbies and interests. Clemson Tigers have passions and service mindsets that guide them to leadership roles in clubs, organizations, sports teams, volunteer activities, the arts, academic clubs and part-time jobs. Let us know about how you led your team to a championship win, the research you’ve conducted or the job you’ve excelled in while maintaining an excellent GPA.

Clemson Tigers come from a variety of backgrounds
We are looking for students who bring varied experiences, knowledge and talents to Clemson. We understand that not everyone has the same opportunities. When reviewing applications, your coursework, activities and curriculum are examined in the context of what is offered in your high school.

Clemson Tigers have unique stories to tell
We want to hear about the skills, experiences, challenges and triumphs that have shaped you. Upload an optional personal statement with your application to let us know if there are specific circumstances that impacted your academic performance for a specific period of time or in a particular class. We want to hear your story.